
How to See Your Social Media ROI in Kukui
Social media performance is usually reported in followers, likes, and reach. Those figures measure attention, not revenue, and for a repair shop, the number that actually matters is how many of those interactions turned into paying customers. Kukui can answer that directly: it attributes revenue to the source each customer came from, so “how much did social media make us?” becomes a figure you can look up rather than estimate.
This guide walks through how to find and read that figure, using Kukui’s Customer Breakdown by Source report. It’s a guide to reading and interpreting the data you already have, not a setup guide, so it assumes a couple of things are already in place.
Before you follow along, you’ll need:
- Access to your shop’s Kukui account, including the dashboard and reporting section.
- Lead-source tracking already set up. That is, your shop is tagging where each customer came from, so Kukui can attribute revenue to a source. This is what populates the report; without it, the source columns will be empty or incomplete. If that isn’t in place yet, start with our guide on tracking where your customers come from, then come back to this one.
With both in place, here’s how to find the report and read it.
The Summary dashboard vs. the source breakdown
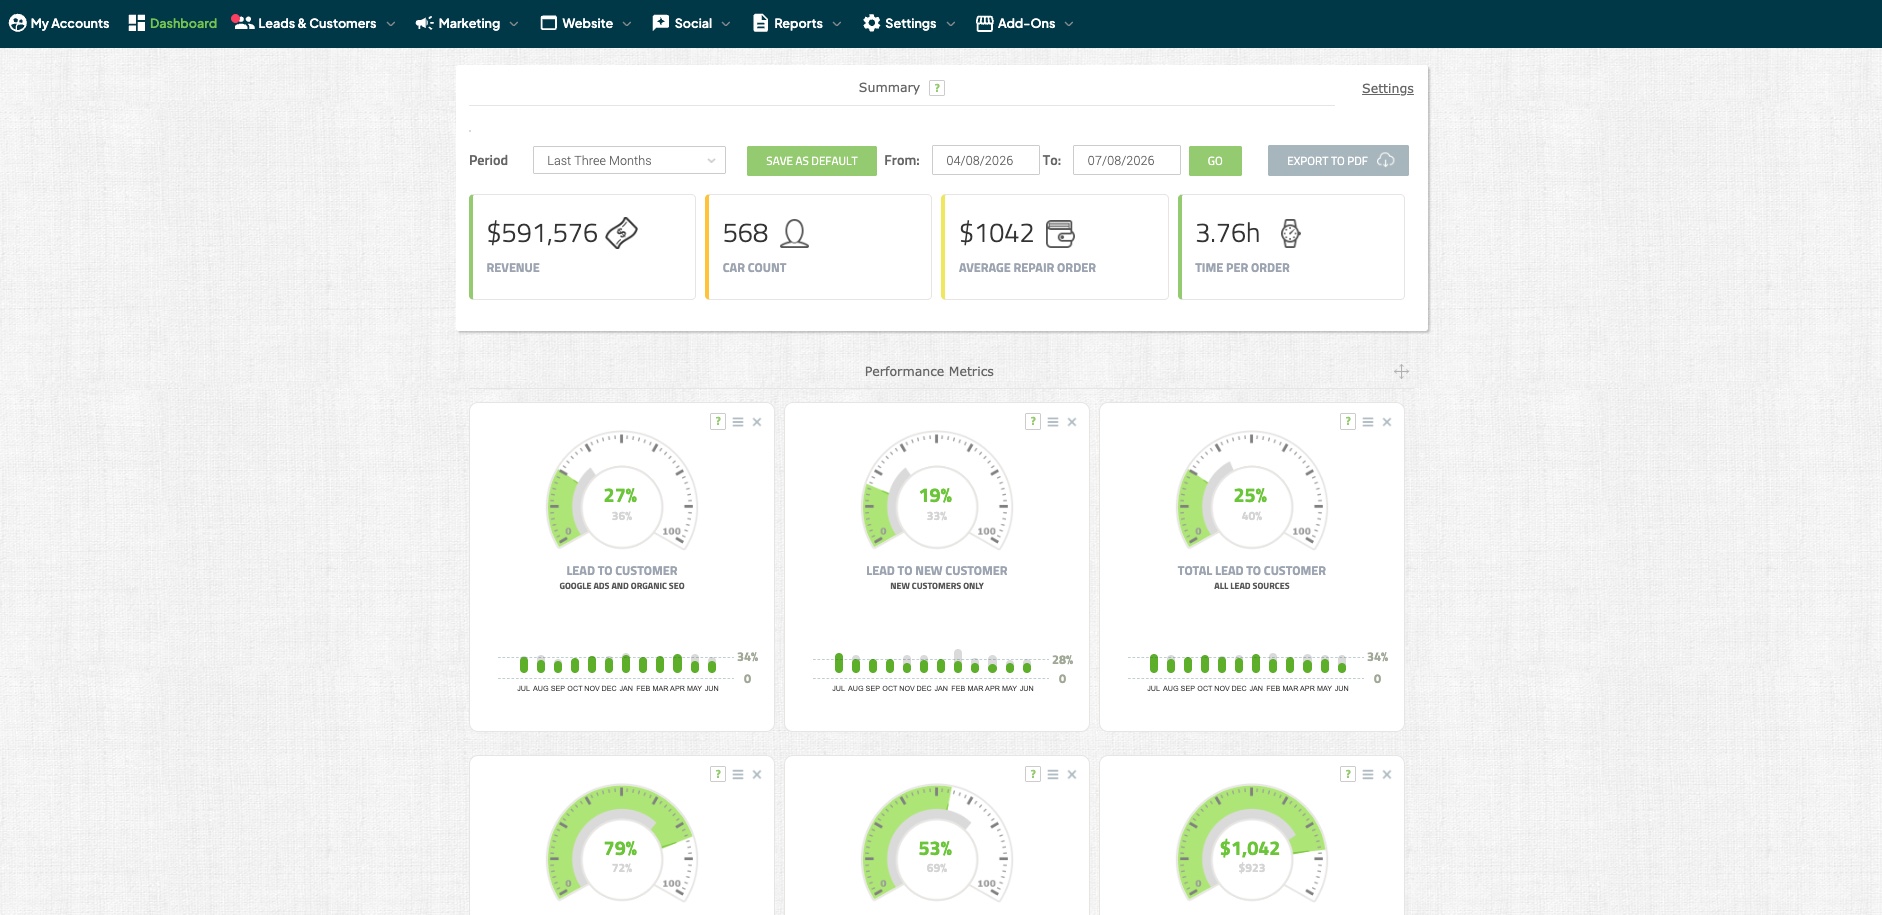
Kukui opens to the Summary dashboard: total revenue, car count, average repair order, and lead-to-customer rate for the selected period. It’s a useful overview of overall performance, but it aggregates every source together, so it can’t isolate the contribution of any single channel.
Attributing revenue to a specific source requires a different view, one that breaks the results out source by source.
It’s worth understanding why the source-level figure is the meaningful one. The value of a customer acquired through social media isn’t limited to their first invoice; it accrues across every subsequent visit (oil changes, brake jobs, tires) for as long as they remain a customer. Revenue by source is the closest available measure of that longer-term value, which is why it’s a more useful number than views or engagement.
Finding the report
1. Log in to Kukui.
Go to Kukui and click Login in the top-right, then sign in with your shop’s credentials. If you manage more than one location, select the account you want to review.
2. Review the Summary dashboard and set the period.
This is the top-level overview: revenue, car count, and performance metrics for the selected timeframe. Use the Period selector near the top to set the window you want to measure (for example, the months a campaign was running), so the figures reflect the right stretch of time.
3. Open the Customer Breakdown by Source report.
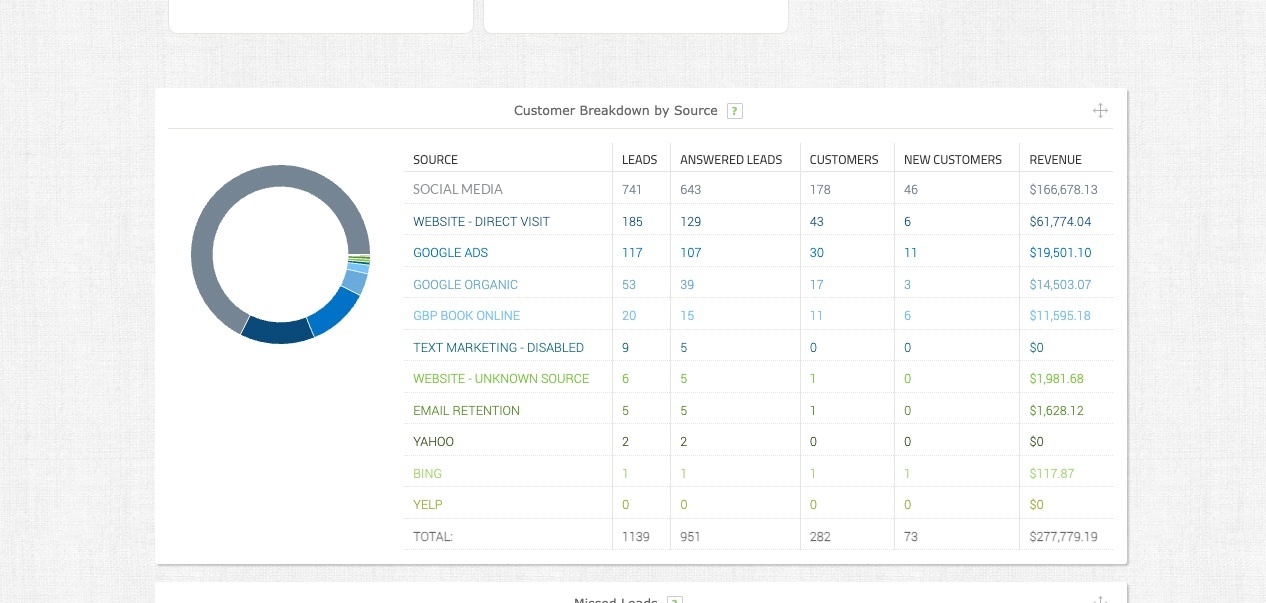
This report lists every lead source in a single table, with columns for Leads, Answered Leads, Customers, New Customers, and Revenue.
Reading the report
Locate the source that corresponds to your social or marketing activity and read across to the Revenue column. That figure is the revenue attributed to customers who first came in through that source during the selected period.
In the example above, the top source is associated with roughly $166,678 in revenue, across 741 leads and 178 customers. Comparing that against the total for all sources shows how much of the shop’s revenue that one channel accounts for.
The intermediate columns are informative on their own. Leads → Answered Leads → Customers describes a funnel: a source that generates a high number of leads but few customers usually points to a follow-up or phone-handling gap rather than a marketing one.
Turning revenue into a return
Revenue by source can be expressed as a simple return by dividing it by the amount spent on that source:
Revenue from a source ÷ amount spent on it = return
For instance, $15,000 spent against $150,000 in attributed revenue is a 10x return. Applying the same calculation to each source gives a comparable view of which ones are producing results.
This is a simplified measure. It doesn’t account for margin, for customers who have yet to return for a second visit, or for referrals those customers generate. It’s sufficient, though, for the basic question of whether a channel is contributing.
What the number represents
The revenue in this report is a point-in-time figure. Because attributed customers continue to return for service, the total associated with a source generally grows over time.
That’s what makes the source breakdown a more durable metric than any single transaction: it reflects the customers a channel has produced, not one visit’s revenue. Reviewed regularly, it turns social-media performance from an open question into a measurable one.
If you’d like help setting up source tracking or interpreting what these figures mean for your shop, 47 Consulting works with auto repair shops on exactly this.