
How to See Your Social Media ROI in Tekmetric
If you’re running social media for your shop, there’s one question that matters more than followers, likes, or reach: are those posts actually turning into paying customers?
Most shop owners can’t answer that. Not because the data isn’t there, but because nobody ever showed them where to look. The good news is that if you’re already tagging where your customers come from, Tekmetric has already done the counting for you. You just have to know which report to open.
This post picks up where tracking leaves off. If you haven’t set up lead-source tracking yet, start with our guide on how to track where your customers come from. That’s what fills this report with data. Once that’s running, here’s exactly how to read the results.
Why you want the Lead Source report, not RO Marketing Source
Tekmetric gives you two reports that look similar at a glance: Customer Lead Source and RO Marketing Source. For measuring social media, you want Lead Source. Here’s the distinction, because it changes how you think about the number.
RO Marketing Source ties a single repair order to a campaign. That’s useful, but it only tells you about one visit.
Customer Lead Source tells you how a customer first found your shop, and that’s the number that actually matters for social media, because the real value of acquiring a new customer isn’t the first ticket. It’s their lifetime value: every oil change, every brake job, every set of tires they buy from you over the years they stay with you. When social brings you a new customer, you’re not buying one repair order. You’re buying a relationship. Lead Source is the report that measures the thing you’re actually paying for.
Finding the report, step by step
The report is buried a few clicks deep, so follow along exactly.
1. Log in at shop.tekmetric.com and choose your location.
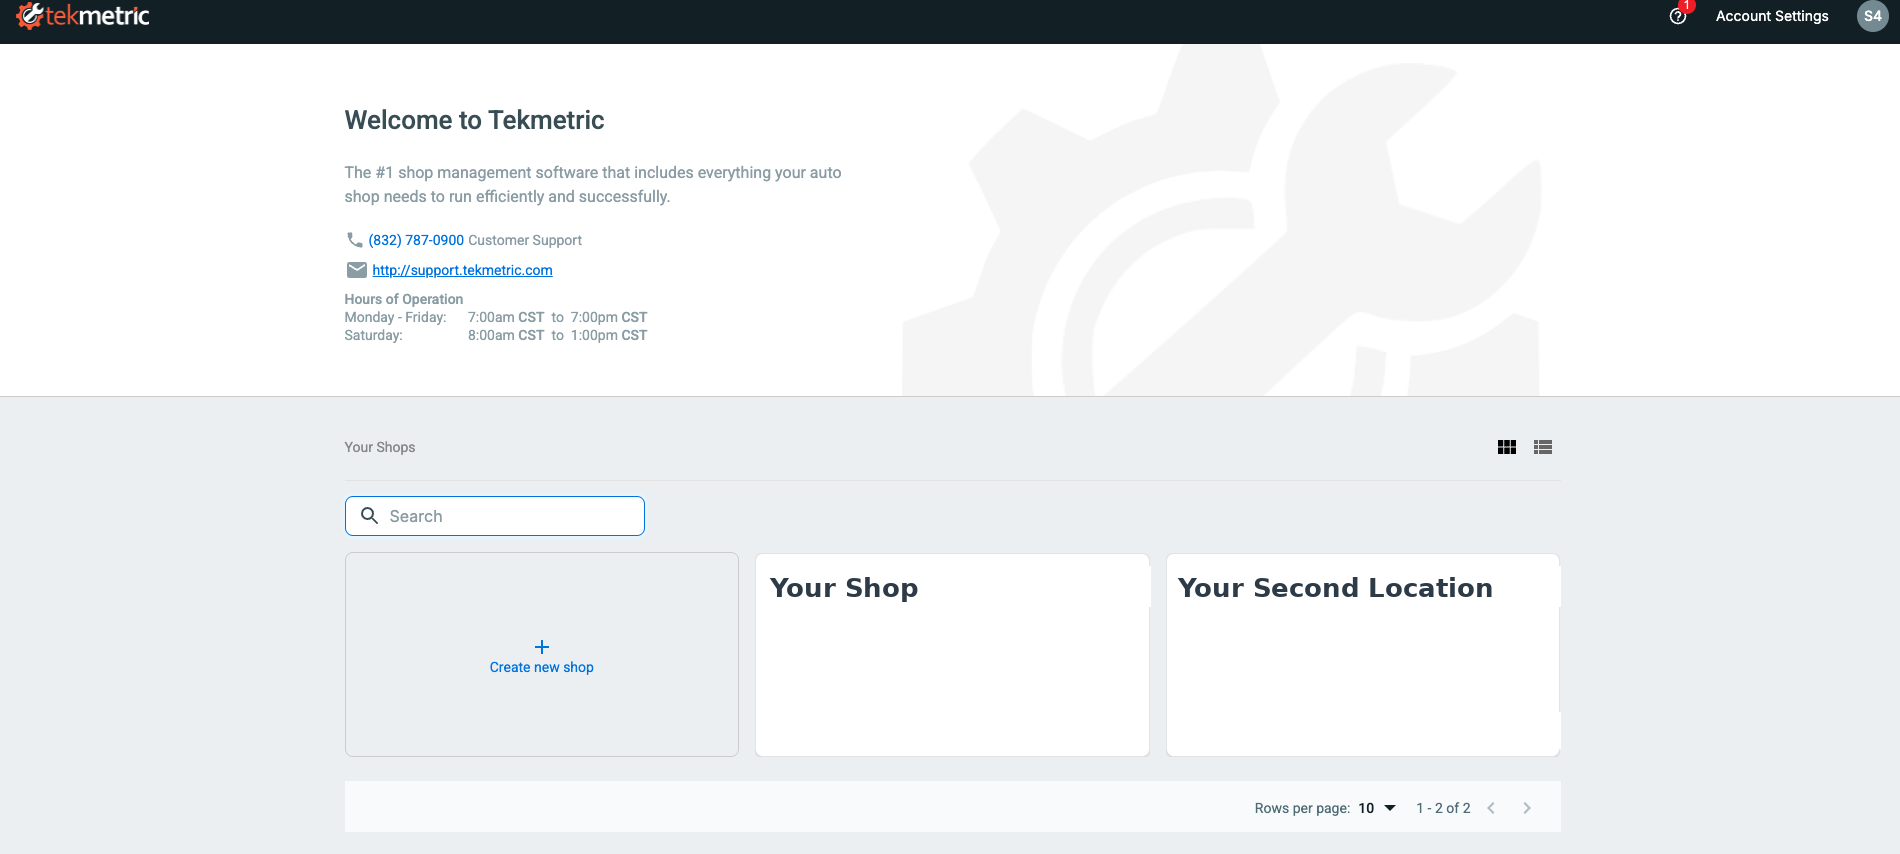
If you run a single location, Tekmetric drops you straight into it. If you’re an MSO with multiple shops, you’ll see a “Your Shops” screen. Pick the location you want to look at.
2. Click Reports in the left-hand menu.
Once you’re inside your shop, the left sidebar has a handful of options. Click Reports. It’ll open on the Financial Reports tab by default. That’s fine, you’re about to switch tabs.
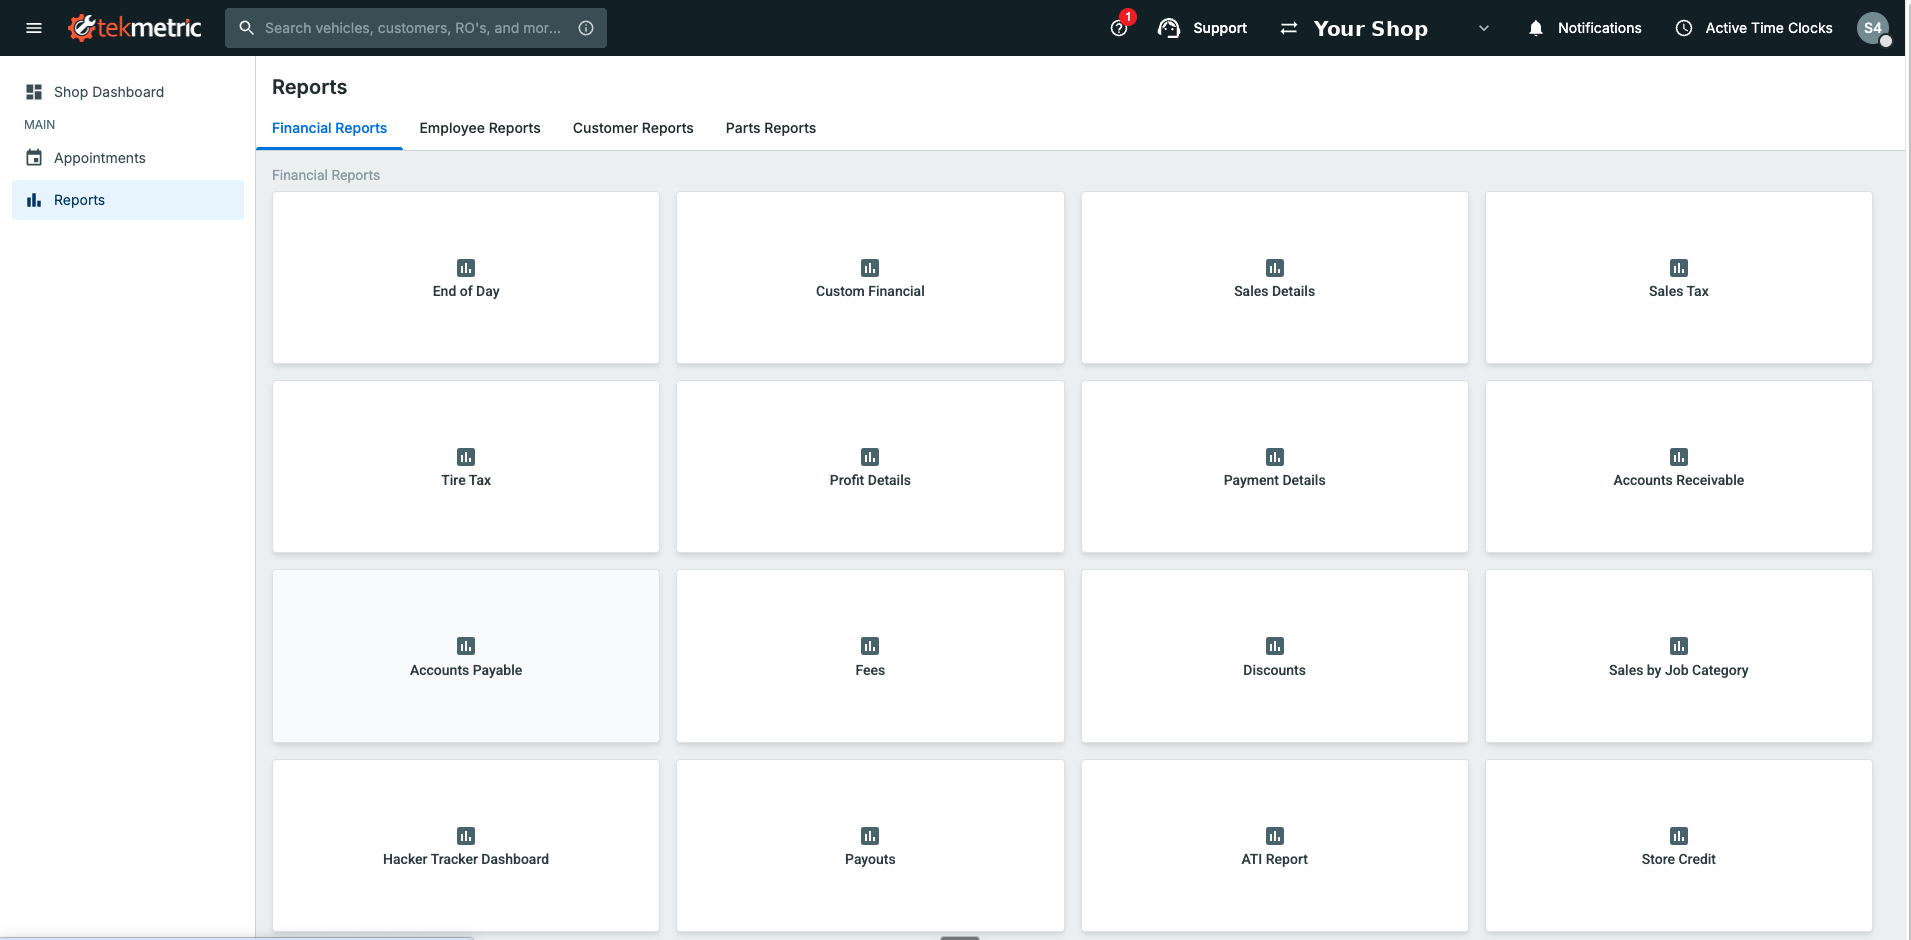
3. Switch to the Customer Reports tab.
Along the top of the Reports page you’ll see four tabs: Financial Reports, Employee Reports, Customer Reports, and Parts Reports. Click Customer Reports.
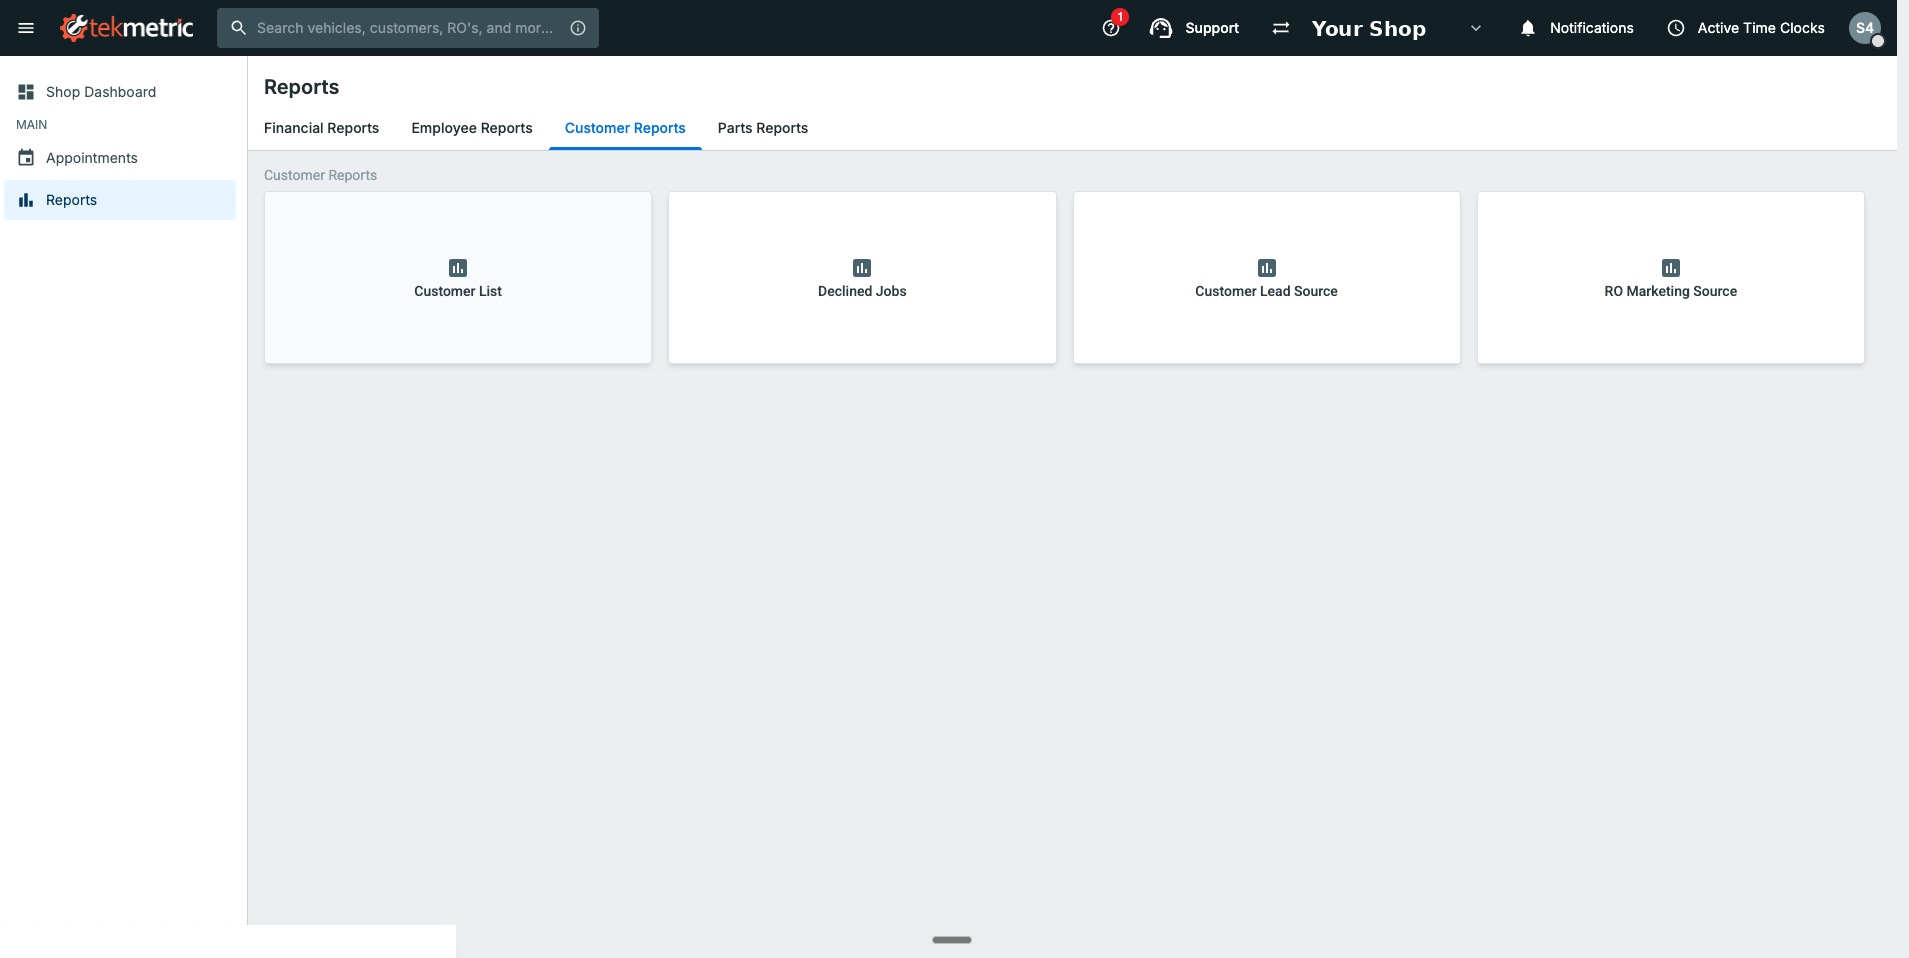
4. Open Customer Lead Source.
The Customer Reports tab shows four cards: Customer List, Declined Jobs, Customer Lead Source, and RO Marketing Source. Click Customer Lead Source.
5. Set your date range.
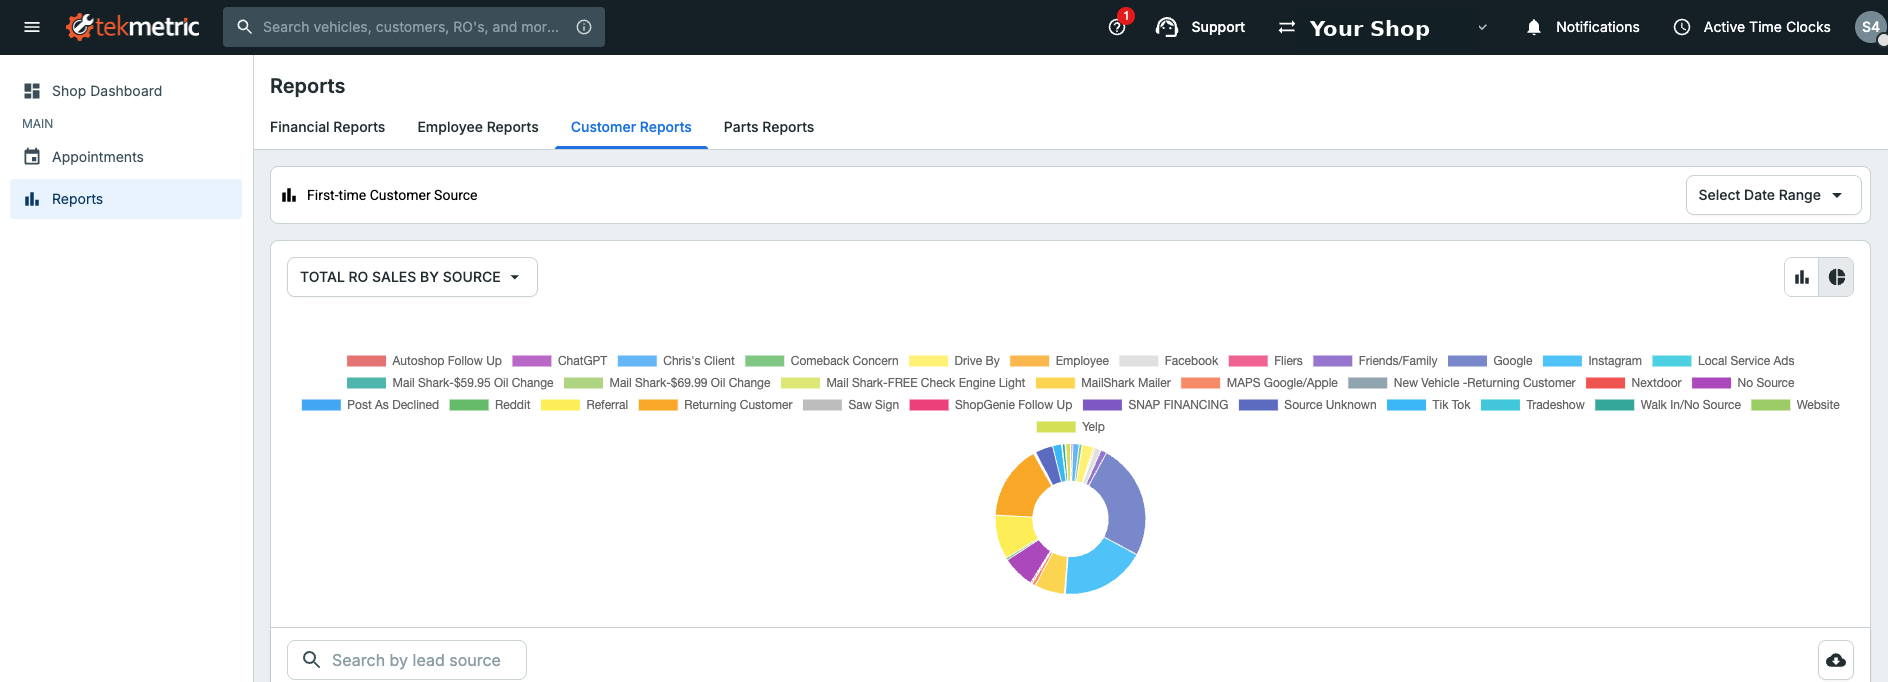
Up top there’s a Select Date Range button. Set it to the period you were actually running social: last month, last quarter, whatever you want to measure. This is important: if you don’t set the range to match your campaign, you’re comparing apples to oranges.
Reading the number
The report opens as a chart titled “Total RO Sales by Source”, a visual slice of where every dollar came from. Below it is a table that breaks the exact same data out line by line, which is where you’ll actually do your reading.
Find your social channels in the list: Instagram, Facebook, TikTok. For each one, the number that matters is Total RO Sales: the real revenue tied to customers who first found you there.
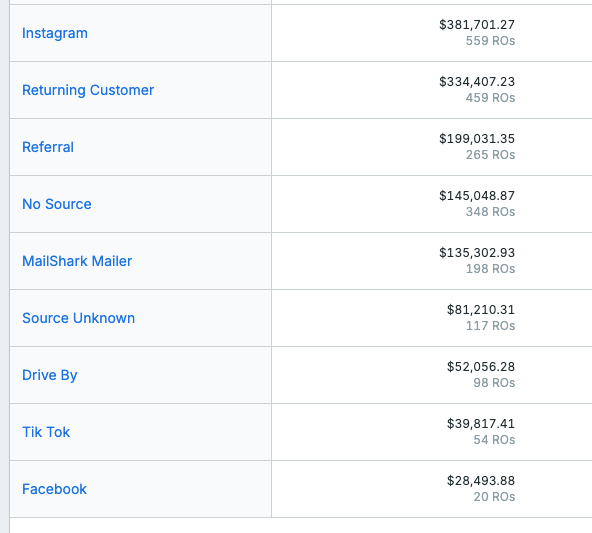
Look at that Instagram line. This shop’s Instagram presence is tied to $381,701 in repair-order sales. That’s not reach. That’s not impressions. That’s revenue in the door. That is the true number, the one that tells you whether social is working.
The simple ROI check
Once you have the revenue number, you can turn it into a return. There are more sophisticated ways to do this, but for a quick, back-of-the-napkin read, the math is just:
Revenue from a channel ÷ what you spent on that channel = your return
Say you spent $8,000 over the year on your Instagram efforts and it’s tied to $80,000 in RO sales. That’s a 10x return. For every dollar in, ten came back. Do the same division for each channel you’re active on, and you’ll instantly see which ones are worth your time and money and which aren’t.
Keep in mind this is the simple version. It doesn’t account for margin, for the customers still on their way back for a second visit, or for referrals those customers send you. But it’s more than enough to answer the only question you started with: is this working?
The bigger picture
Here’s the part most owners miss. That revenue figure isn’t the finish line. It’s a snapshot in time. Every customer social brought you is still out there, still driving, still needing service. The number in that report only grows as they come back.
That’s why Lead Source is the report to watch. It doesn’t measure a transaction. It measures the customers you’ve earned. And once you can see that number clearly, you’re no longer guessing about social media. You’re managing it.
If you want help getting this set up (the tracking that feeds this report, and a clear read on what the numbers are actually telling you), contact 47 Consultants.